PROJECT DETAILS
Infographic Business Pack
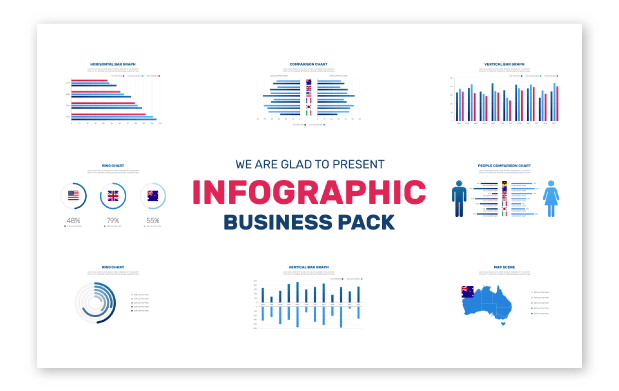
This Infographic Business Pack is a perfect way to show your corporate analytics, present annual report or company statistics, make data overview or startup presentation, it will be usefull for explainers and data animations, broadcast or financial news. This pack was designed in colaboration with economists, which makes this project not only visually attractive, but also economically correct.
Project Date: 28 June 2018
AFTER EFFECTS TEMPLATE
Infographic Business Pack
In order to serve the wide range of needs, this pack is designed in 11 sections, each has a design variations of Vertical and Horizontal Bars, Comparison and Line Charts, Circle, Ring and Pie Charts as well as People, Maps and Timeline.

